Gov 1347
Samuel Lowry
The Effect of COVID
October 25, 2020
In 2017, Achen and Bartel famously wrote about the effects of shark attacks on elections in their book entitled Democracy For Realists. Such pursuits, on their face, appear trivial. How would shark attacks affect election outcomes? Why is that even a question worth asking? When thinking more broadly, it becomes clear. Natural disasters, despite their randomness, necessitate political action. For example, Healy et al. (2020) looks at instances of tornadoes. Depending on the political response (state of emergency, aid, etc.), the incumbent’s vote share was affected. Therefore, as the random necessitates action, it becomes political.
2020 has had one of the greatest shocks ever during a presidential election: COVID. While random, it has seemingly had an outsized effect on the election. This week, I sought to quantify that effect. How does an increase in deaths in a state affect general election poll numbers for President Trump? What about an increase in testing? It should be noted that the causal relationships here are not clear. It cannot be assumed that COVID is the only issue affecting the minds of voters. Nevertheless, we can look at the association between the two.
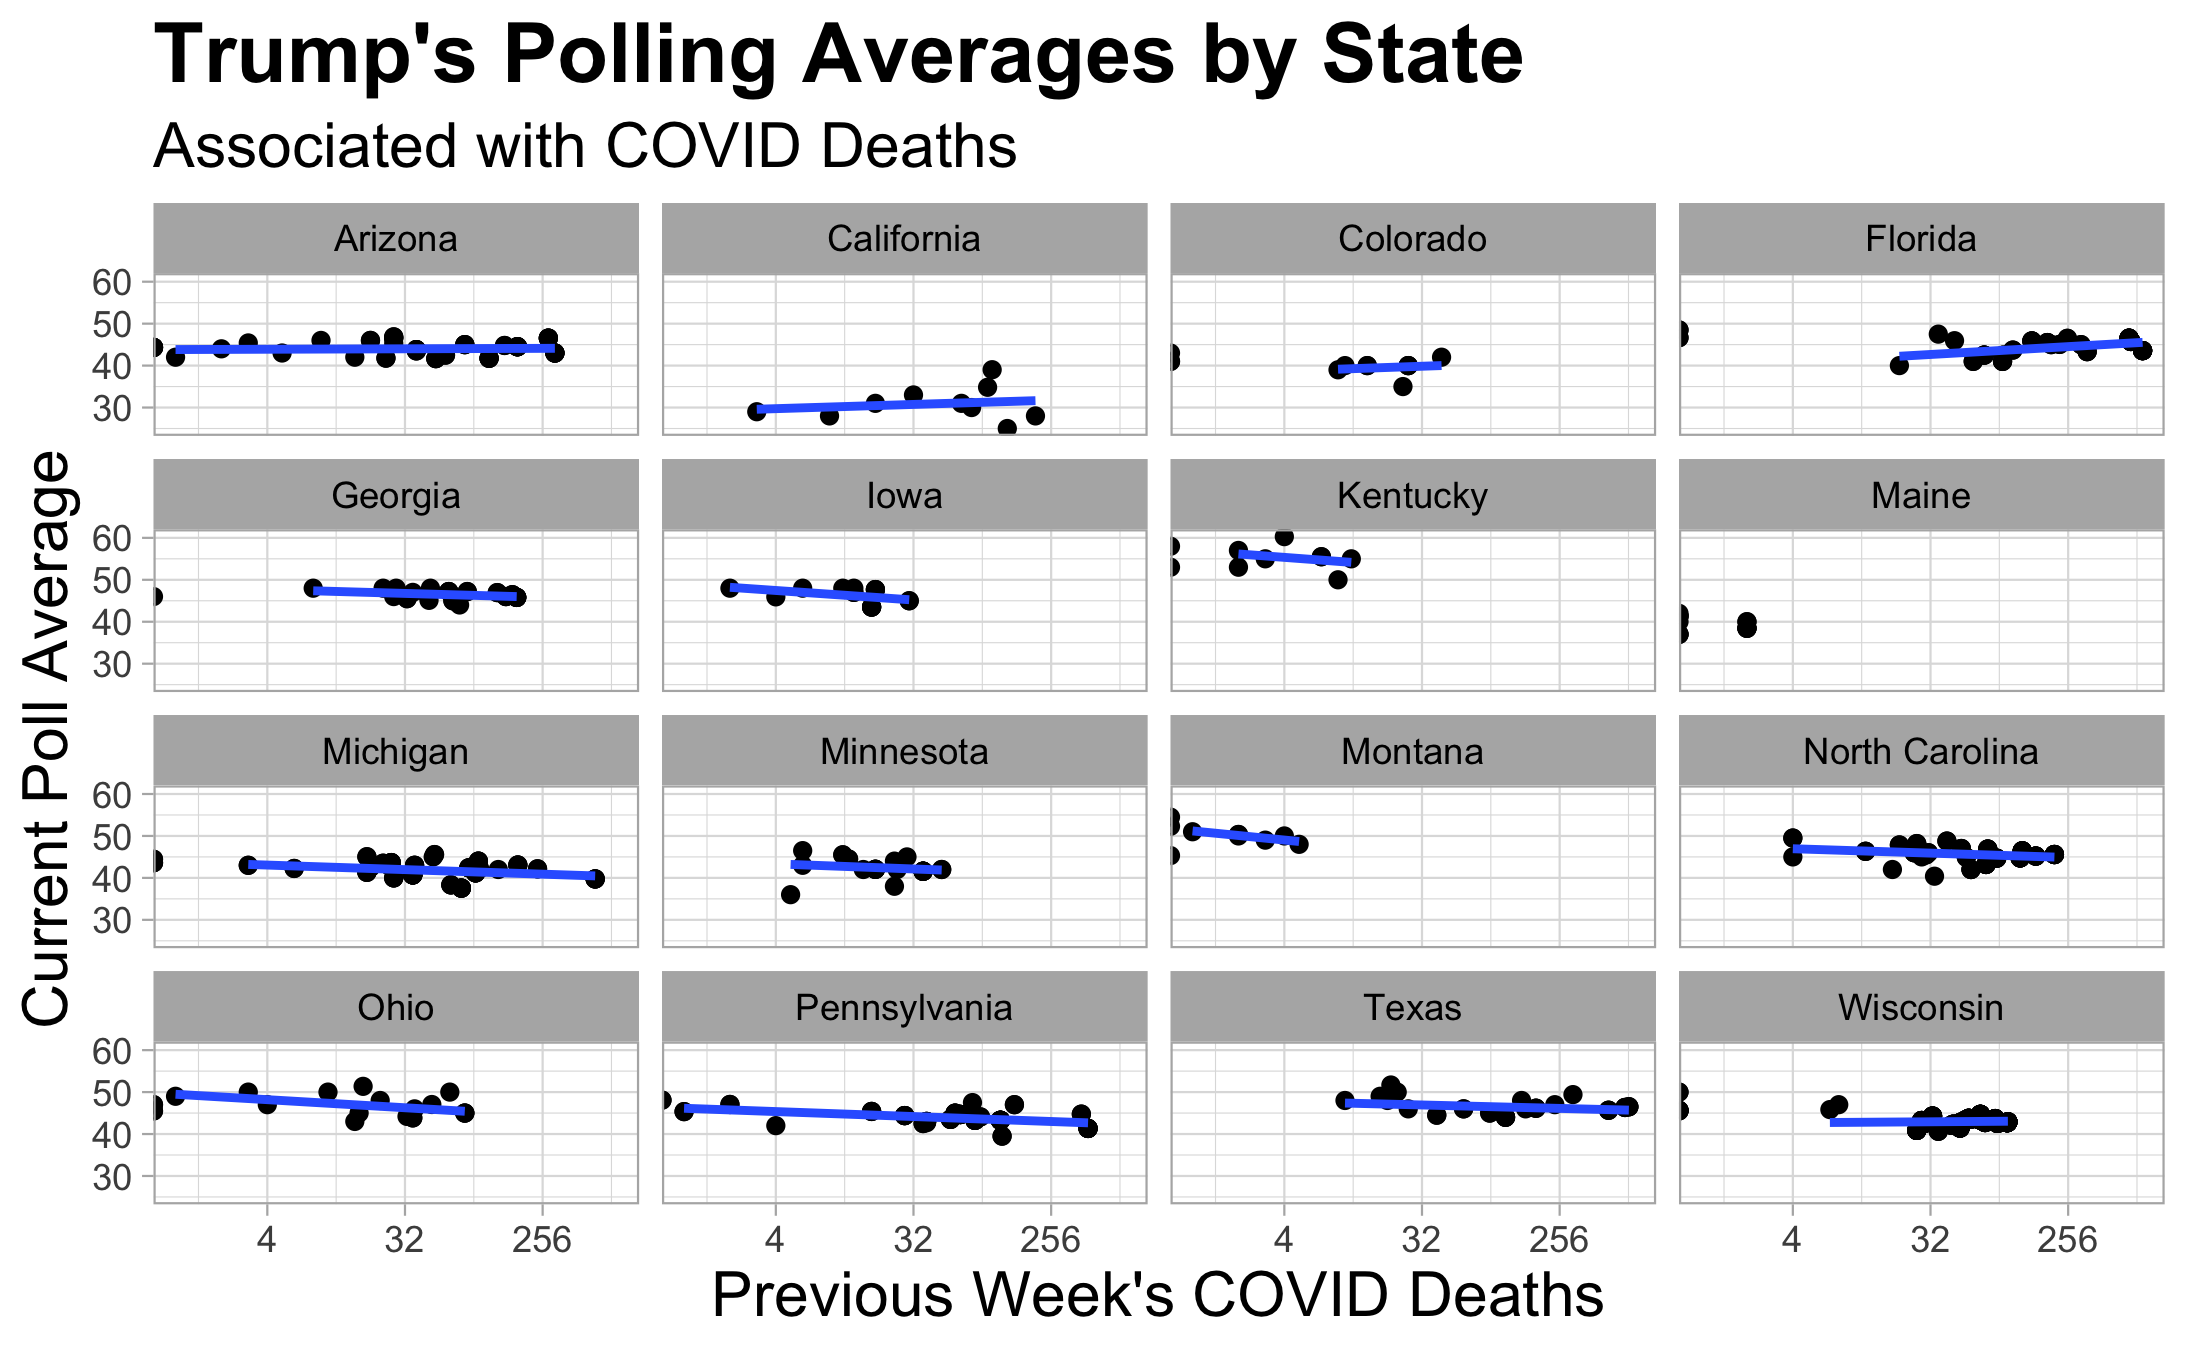
First, I looked at an increase in COVID deaths by state with the reasoning that people dying within your state due to the pandemic may affect your feelings about the current administration. The x-axis depicts the increase in COVID deaths in a given week. The x-axis is also scaled using log2 in order to better display the points. Due to the variability in COVID deaths by state, the associations otherwise would not have been otherwise visible in all states. The y-axis shows the mean poll number from the next week to allow for public opinion to catch up. This set of 16 states is not random. They are the states with enough polling data and data on COVID deaths to depict some sort of relationship with at least 10 observations—representing 10 different weeks.
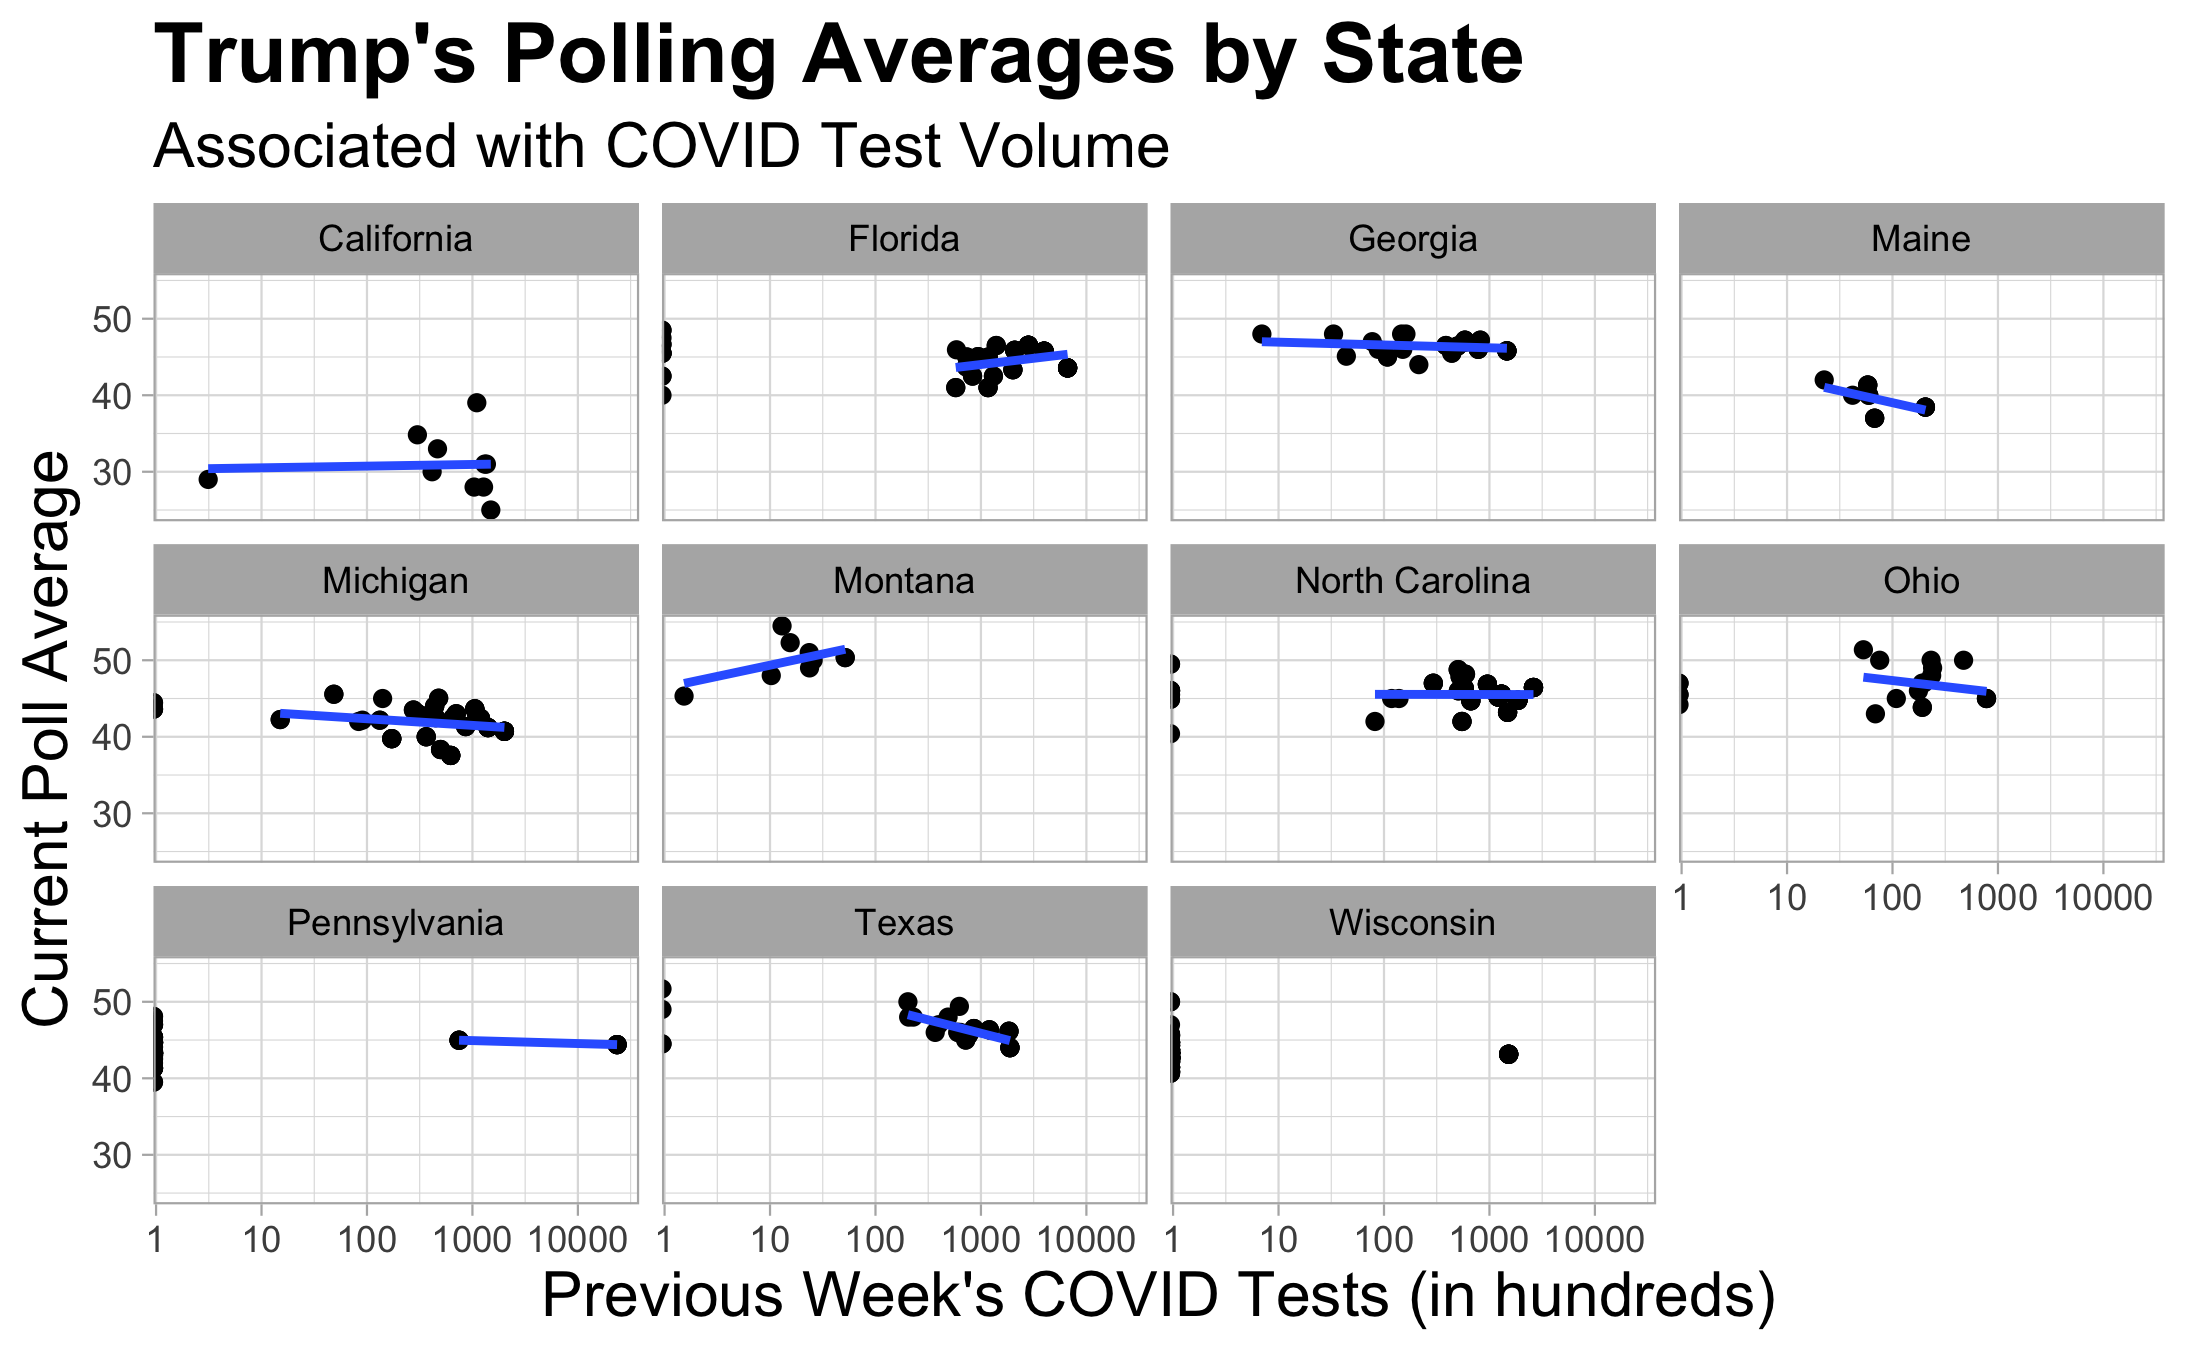
Second, I looked at an increase in COVID testing by state with the reasoning that testing within your state, a sign of a political response to the pandemic, may affect your feelings about the current administration. The x-axis depicts the increase in COVID tests in hundreds in a given week. The x-axis is also scaled using log10 in order to better display the points. Due to the variability in COVID deaths by state, the associations otherwise would not have been otherwise visible in all states. The y-axis shows the mean poll number from the next week to allow for public opinion to catch up. This set of 11 states is not random. They are the states with enough polling data and data on testing volume to depict some sort of relationship with at least 10 observations—representing 10 different weeks.
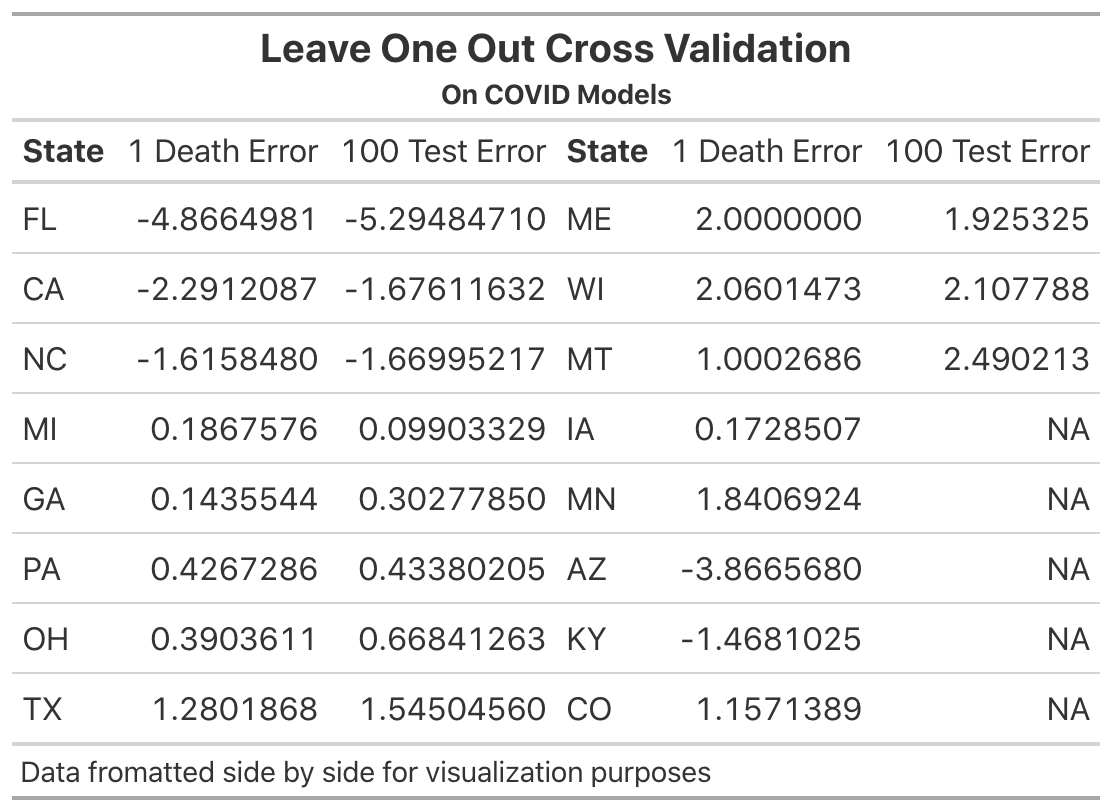
In order to evaluate the models, I utilized leave-one-out cross-validation. The datasets were already quite small with some states only having 10 observations. Therefore, I was unable to use out-of-sample testing. To perform the cross-validation, I selected out a row from every state’s data and created the respective models. Then, I used the model to predict the poll average for the selected row. By taking the difference between the prediction and the actual, I was able to find the error of the model. The errors are very state dependent, and it should be noted that leaving one out had different effects on different states due to the number of observations by state. The number of observations spanned from 10 to 202. At the same, error is not just dependent on the number of observations. Florida has the largest error and also has a relatively large number of observations at 61. Nevertheless, such an error could be from selecting an outlier row from the data for cross-validation.
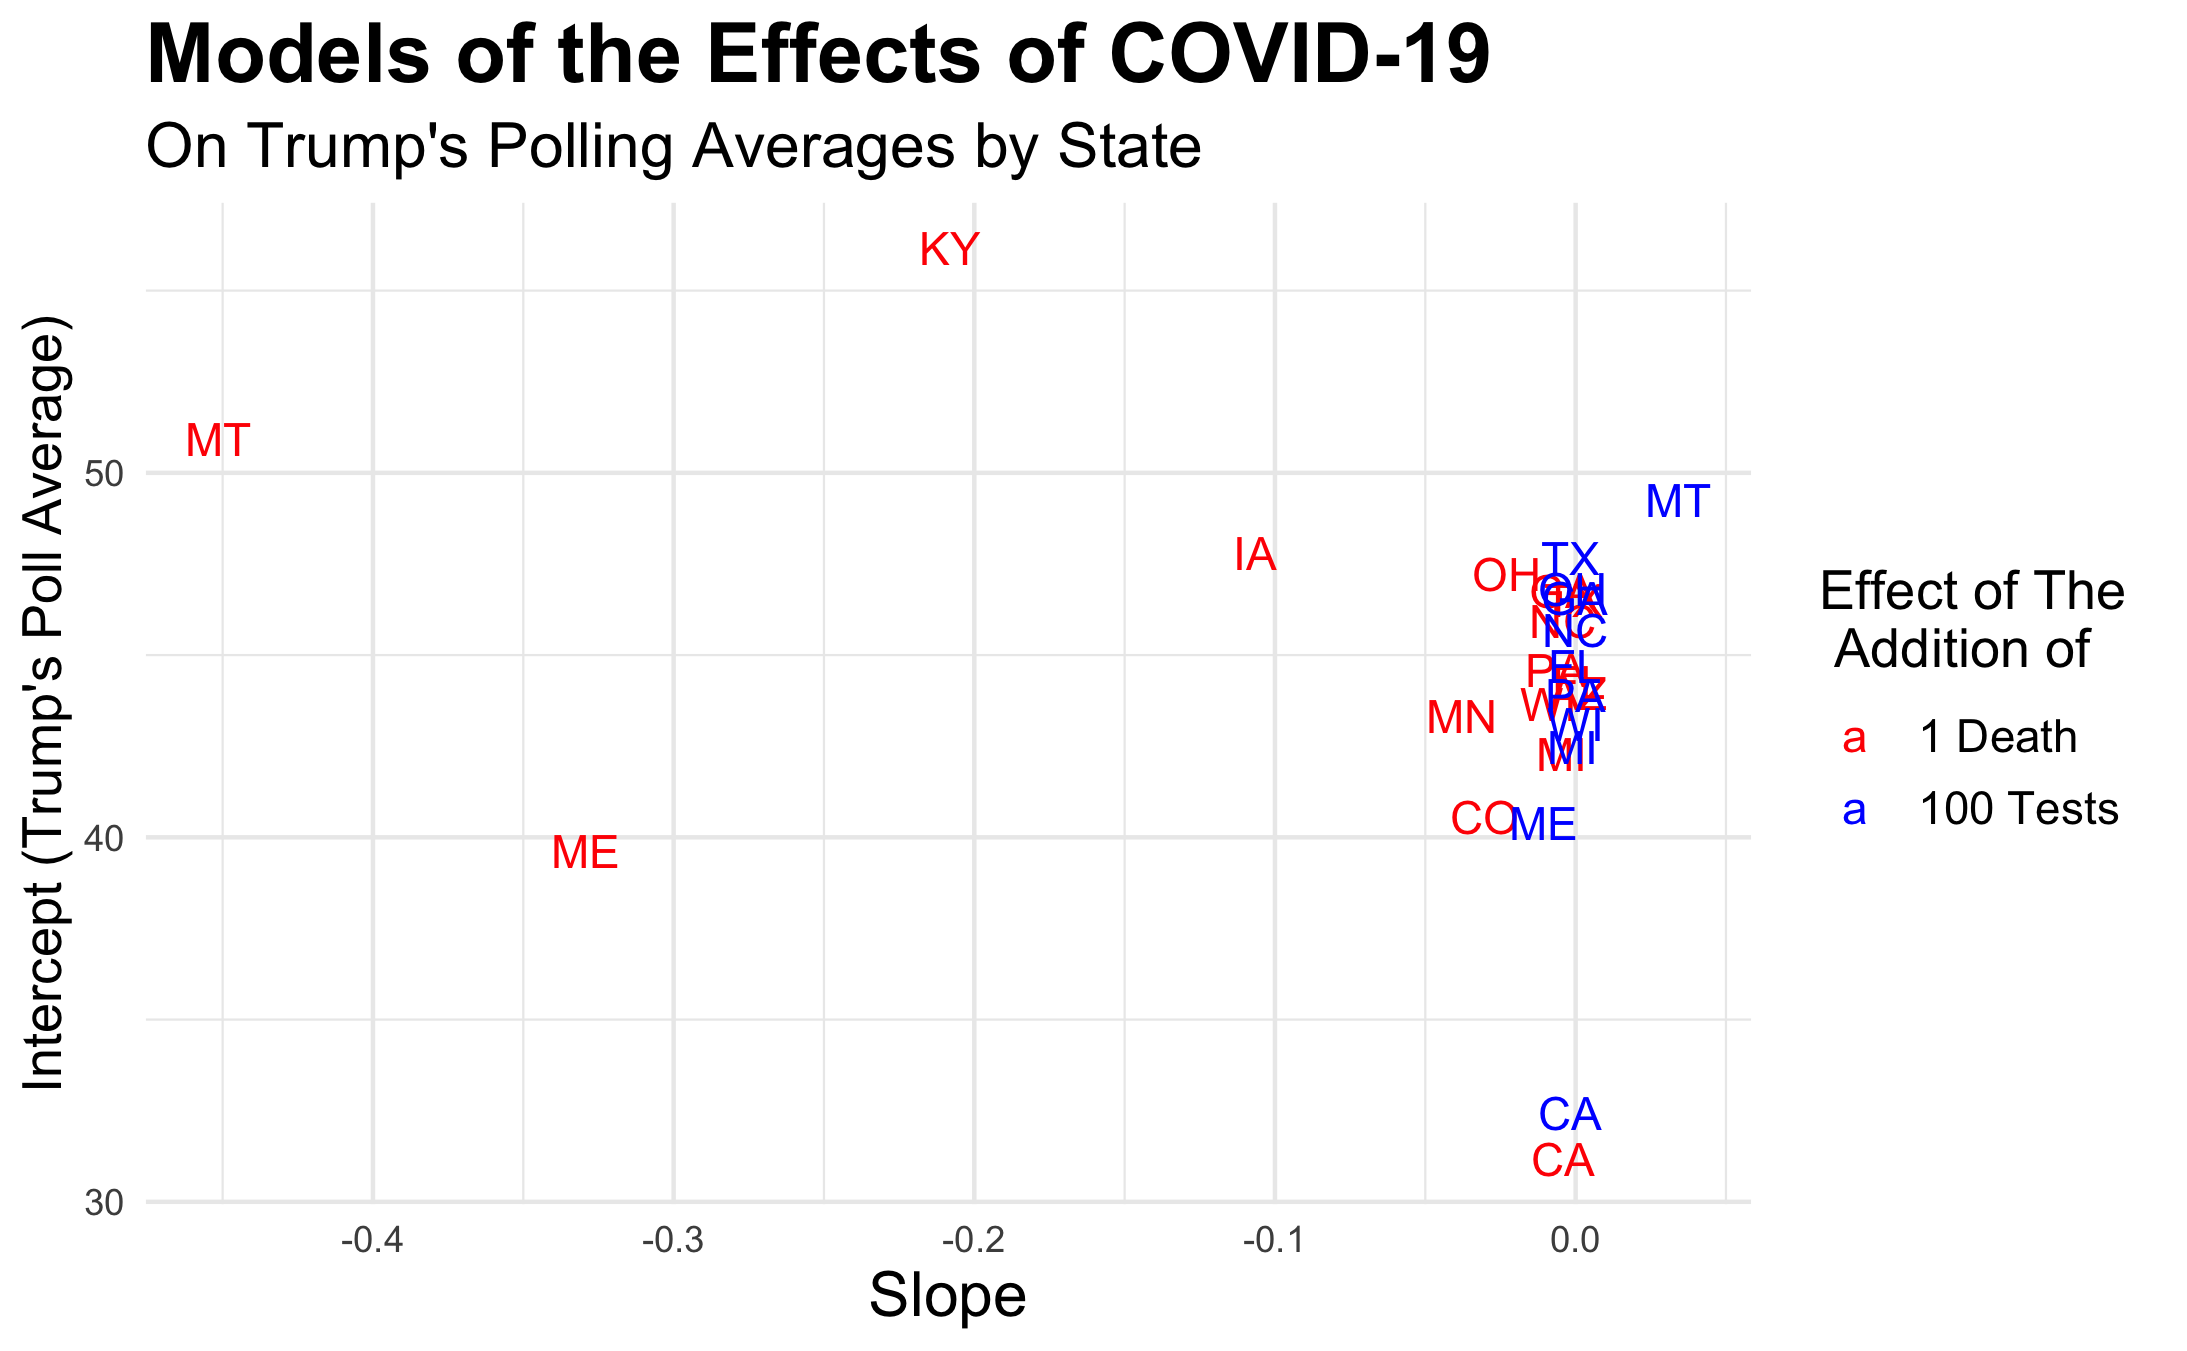
Is an increase in COVID deaths associated with lower poll numbers for Trump? Is an increase in COVID testing associated with higher numbers? All in all, the jury is still out. While the Montana, Kentucky, Maine, and Iowa slopes suggest that there is an inverse relationship between COVID deaths and Trump poll numbers, all other slopes hover close to zero including all of those for testing volume. For me to include COVID data in my election prediction, I will have to further tweak my models and determine a more robust relationship. Nevertheless, due to the current lack of a concrete relationship, I doubt that I will include COVID data for all states within my final prediction model.
The polling data were sourced from the course’s Canvas page. The COVID data were sourced from here. The code to replicate the above graphics can be found here.